H-R Diagram
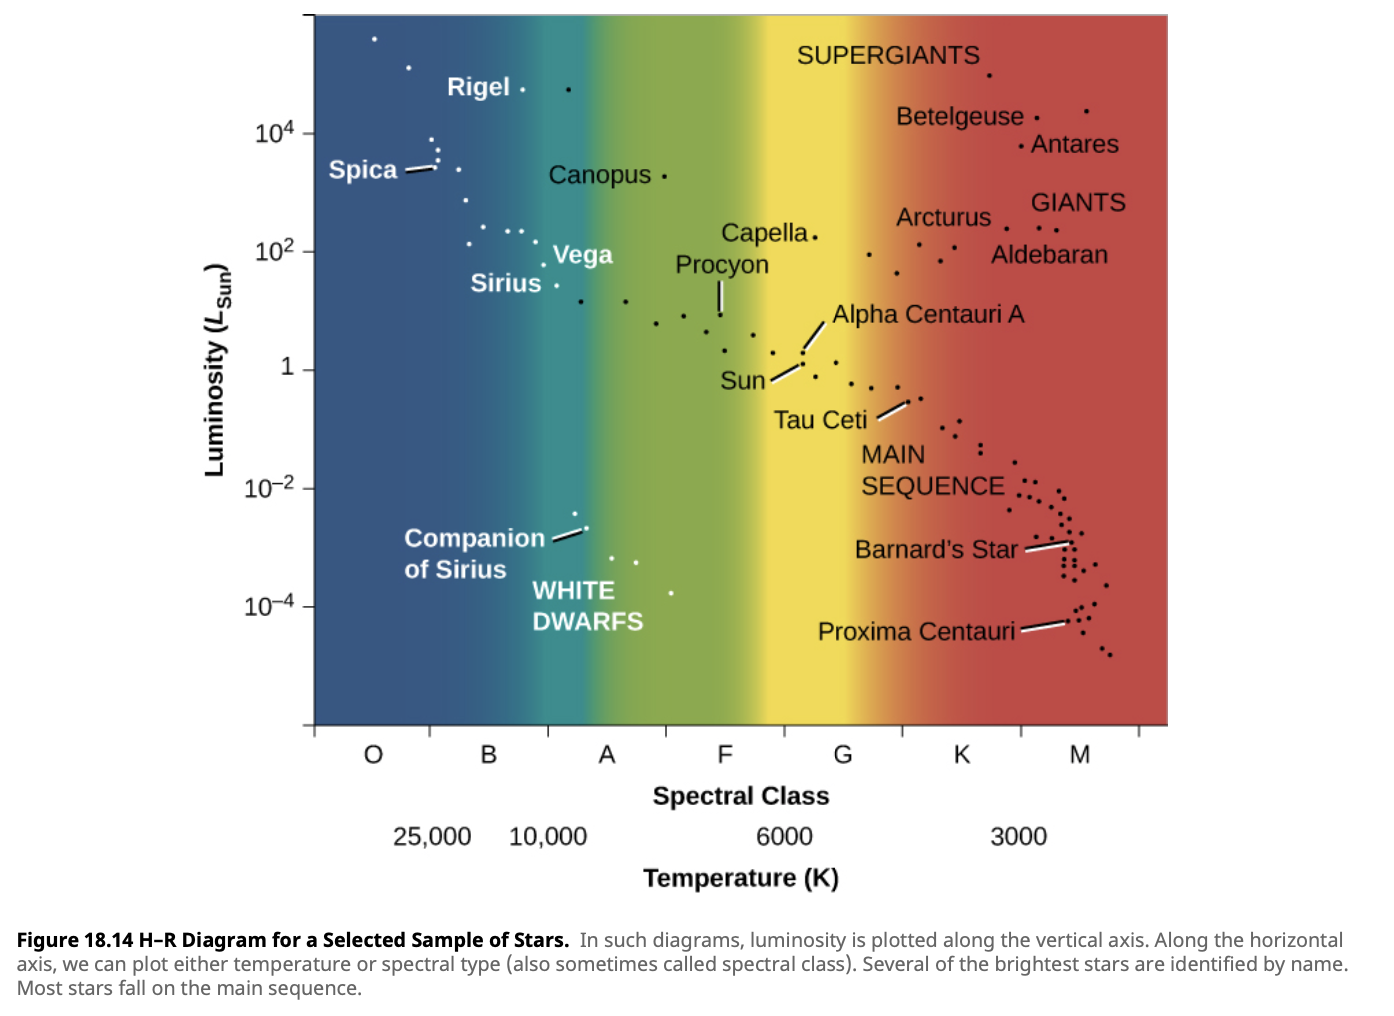
- Hertzspring-Russell diagram
- Plots luminosity on the $y$-axis
- Plots either temperature or spectral type on the $x$-axis
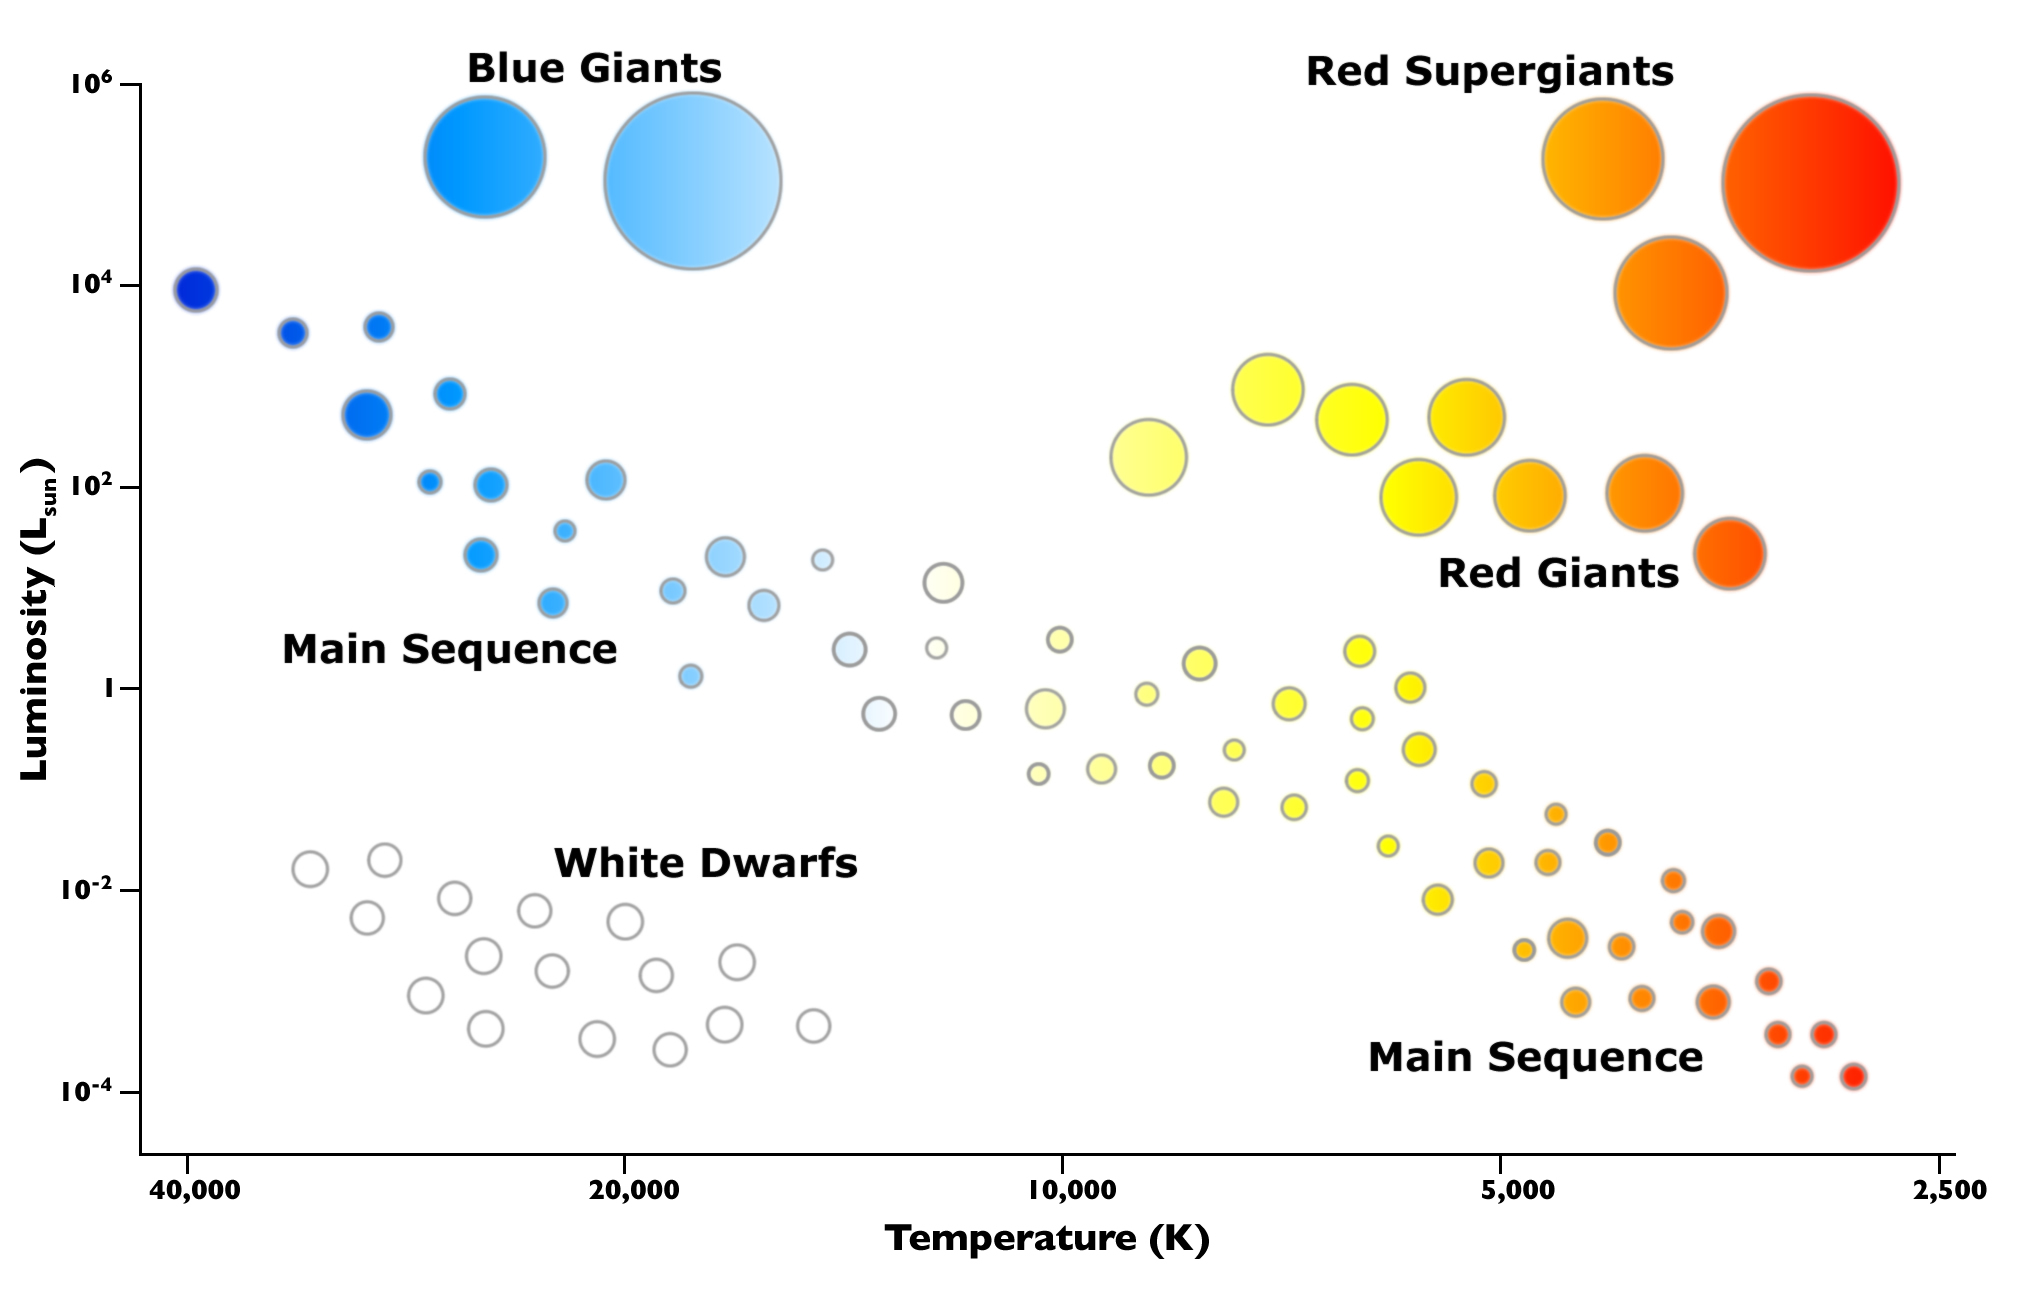
- Main sequence stars represent a relationship between temperature and luminosity that most stars follow
- A band running from upper left (hot, more luminous) to the lower right (cool, less luminous)
- Hotter stars are more luminous than cooler ones
- More massive stars are hotter than less massive ones
- More mass --> more gravity --> greater compression at their core
- Greater compression at the core leads to better energy generation and thus more luminosity and heat
- Can be used to measure the distance of stars
Astronomy Star